Weather Map
The weather map provides a comprehensive, real-time view focused on current meteorological conditions across Vermont by integrating multiple data sources to support emergency operations.
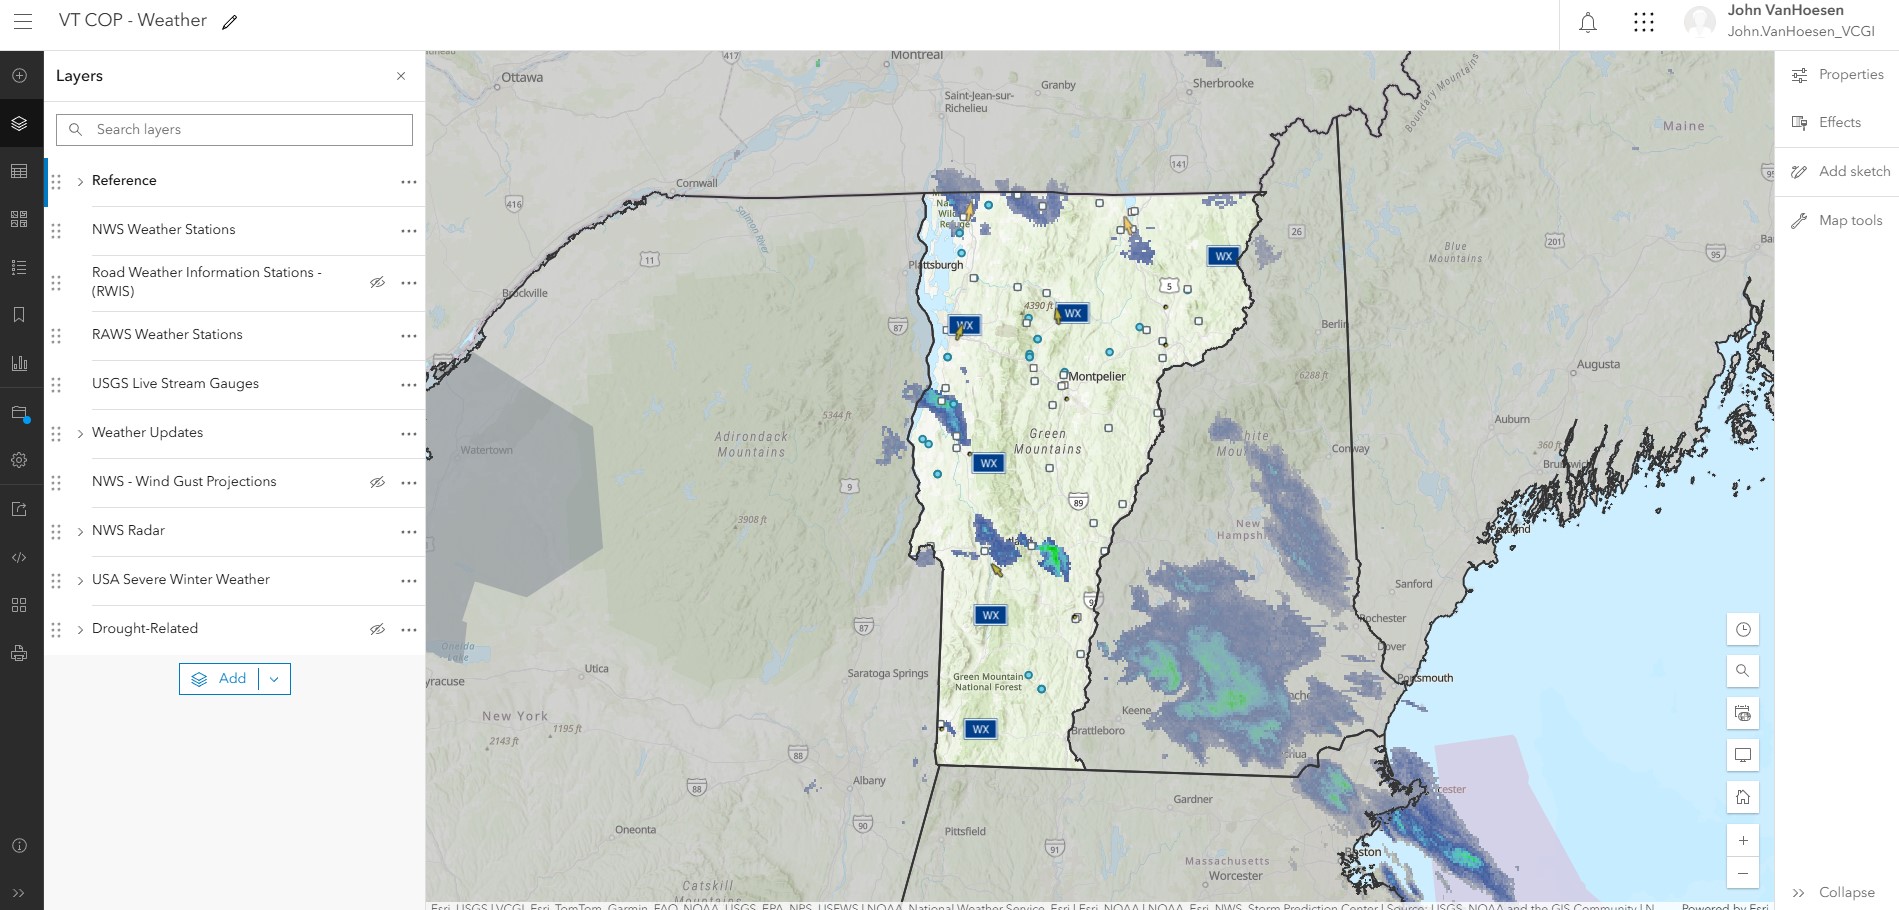 The weather map (named Weather - Current) is accessible here. It contains both grouped and ungrouped layers from internal and external sources.
Purpose
This map provides detailed weather information for:
- Pre-event planning and preparation
- Storm tracking and monitoring
- Historical weather analysis
- Forecast verification
Data Layers
Layer Visibility
Many layers are only turned on (visible by Default) seasonally or during SEOC activation. For example, NWS Ice Accumulation would only be turned on with sufficient warning of an impending ice storm.
| Group | Layer Name | Symbology | Source |
|---|---|---|---|
| NWS Weather Stations | Classified by Wind Speed (km/h) |
NWS | |
| Road Weather Information Stations (RWIS) | ESRI basic point | VTrans | |
| RAWS Weather Stations | ESRI basic point | NIFC | |
| USGS Live Stream Gauges | Classified by Status |
USGS | |
| Red Cross Trailer Locations | ESRI basic point | Red Cross | |
| Weather | USA Storm Reports | Classified by INCIDENT_TYPE |
NOAA |
| Weather | NOAA Hail Storm Reports | ESRI basic point | NOAA |
| Weather | NOAA Wind Storm Reports | ESRI basic point | NOAA |
| Weather | Current NWS Events | Classified by Subject Type |
NOAA |
| Weather | NOAA Severe Thunderstorm Warnings | ESRI basic polygon | NOAA |
| Weather | NOAA Tornado Warnings | ESRI basic polygon | NOAA |
| Weather | NOAA Flash Flood Warnings | ESRI basic polygon | NOAA |
| Weather | NOAA Special Marine Warnings | ESRI basic polygon | NOAA |
| Weather | Active Hurricanes, Cyclones, & Typhoons | Multiple layers | NOAA |
| Weather | Wind Gust Projections | Classified by Speed Class |
NWS |
| Weather | NWS Radar | Classified by conus_bref_qcd |
NWS |
| Weather | NWS River Gauges | Classified by Flood Status |
NWS |
| Winter Weather | Ice Accumulation Forecast | Multiple layers | NWS |
| Winter Weather | Snowfall Forecast | Multiple layers | NWS |
| Drought | Public Reports CMOR | ESRI basic point | CMOR |
| Drought | US Drought Monitor -Current | Classified by DM |
USDM |
Reference Layers
The reference layers group is at the top of the table of contents to create a visual mask so that data within Vermont is highlighted, but the user can still data in surrounding states.
| Group | Layer Name | Type | Source |
|---|---|---|---|
| Boundaries | U.S. States and Territories | Polygon | NOAA |
| Boundaries | Vermont Counties | Polygon | VCGI |
| Boundaries | Vermont Towns | Polygon | VCGI |
| Boundaries | NA Political Divisions Polygons (mask) | Polygon | NAEA |
Layer Details
External Sources
The following layers are consumed from external, authoritative sources. These sources include Vermont agencies and departments and external partners like the NWS, USGS, FEMA, etc.
NWS Weather Stations
Source: NWS
Geometry Type: Point
Coordinate System: Web Mercator (EPSG:3857)
Update Method: Automatically updated by NWS
Pop-Up Attributes:
STATION_NAME: Unique weather station nameOBS_DATETIME: Date and time of reported observationWIND_DIRECT: Wind direction recorded by weather station (in degrees)WIND_SPEED: Wind speed recorded by weather station (in km/h)TEMP: Temperature recorded by the weather station (in fahrenheit)SKY_CONDTN: Description of sky conditionsVISIBILITY: A measure of the horizontal distance at which a person can clearly see and identify a prominent dark object against the horizon sky (during the day) or a moderately intense light source (at night)
Symbology:
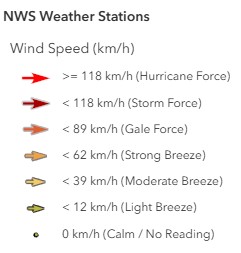
Color-coded by WIND_SPEED
Icon: Geometric symbols imported from ESRI basic polygons
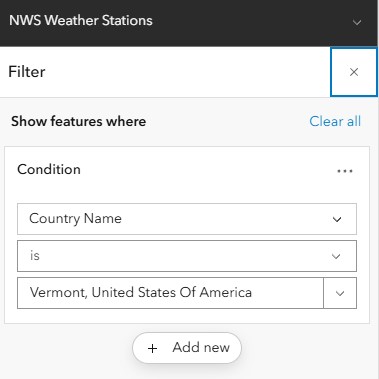
Filter:
Filtered by Country Name
NWS Weather Stations Updates
NWS weather data is "near real-time. The data displayed in the weather map is typically 5 to 20 minutes old and the standard update cycle is only once per hour unless something of importance happens.
Road Weather Information Stations - (RWIS)
Source: VTrans
Geometry Type: Point
Coordinate System: Vermont State Plane (EPSG:32145)
Update Method: Automatically updated by VTrans
Pop-Up Attributes:
Name: Unique weather station nameStatus: This field is strictly reporting the health of the communication linkroadway: Roadway adjacent to the weather stationAirTemp: Standard ambient air temperature (in fahrenheit)DewPoint: A value derived from the air temperature and relative humidity sensors (in fahrenheit)WindSpeed: Wind direction recorded by weather station (in mph)WindDir: Wind direction recorded by weather station (in degrees)Direction: Wind speed recorded by weather station (in km/h)PavementTemp: The actual temperature of the road pavementPrecipRate: Intensity of rainfall or snowfall (in/hr)RoadSurfaceCond: The condition of the roadway. Values typically include: dry, wet, chemically wet, ice, snow, slushSubsurfaceTemp: The temperature of the soil ~18 inches below the roadSurfaceFriction: WA calculated value (often 0.0 to 1.0) representing how slippery the surface isVisibility: Distance one can see (in miles)Timestamp: Date and time of reported observation
Symbology:
ESRI basic point
Icon: Geometric symbols imported from ESRI basic polygons
Road Weather Information Stations Updates
RWIS weather data is "near real-time. The stations are programmed to report a new observation every 10 minutes. During active winter storms, VTrans can remotely command stations to switch to "polling mode" or increase their reporting frequency (~5 minutes)
RAWS Weather Stations
Source: NIFC
Geometry Type: Point
Coordinate System: WGS1984 (EPSG:4326)
Update Method: Automatically updated by NIFC
Pop-Up Attributes:
Agency: Agency that owns the stations (e.g., USFS, BLM, etc.).StationName: Unique weather station nameStatus: Weather station status (A = Active, I = Inactive, M = Maintenance)Ob Time: The time the sensor actually took the readingElevation: Ground elevation of the weather station (in feet)Air Temperature, Standard Placement: Standard ambient air temperature (in fahrenheit)Relative Humidity: The percentage of water vapor present in the air compared to the maximum amount the air can hold at the same temperature (in %)Rain Accumulation: Cumulative rainfall at the site, relative to a start date on October 1st (rainfall = 0) and accumulate until September 30th of the following yearWind Speed MPH: Wind speed recorded by weather station (in mph)Wind Direction: Wind direction recorded by weather station (in degrees)Solar Radiation: The intensity of sunlight hitting the ground (in W/m²)Fuel Moisture: The moisture content of dead vegetation (specifically "10-hour" fuels, which are sticks 1/4" to 1" in diameter) - (in %)Fuel Temperature: The temperature of the fuel stickMesoWest Detailed Weather Link: A website run by the University of Utah that aggregates all US weather dataNOAA Detailed Weather Link: The National Weather Service observations page
Symbology:
ESRI basic point
Icon: Geometric symbols imported from ESRI basic polygons
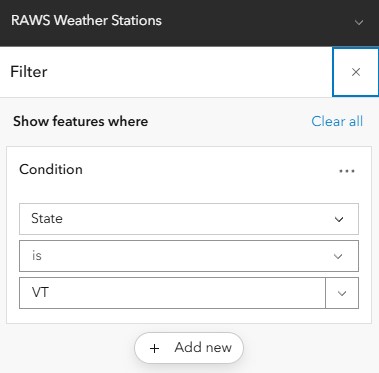
Filtered by State
RAWS Weather Stations Updates
RAWS weather data is "near real-time. The stations are programmed to report a new observation every hour.
USGS Stream Gauges
Source: USGS Geometry Type: Point Coordinate System: Web Mercator (EPSG:3857) Update Method: Automatically updated by USGS
Pop-Up Attributes:
stationid: The unique 8-to-15 digit identifier assigned by the USGSorg: The agency managing the data feed. Usually USGS, but can sometimes include partners like USACE or local water districtsname: Location description (river + town + state)status: The current flood condition relative to NWS flood thresholdsheight: Refers to gauge height; the vertical distance of the water surface above the station's reference datum (in ft)flow: Refers to discharge; the volume of water moving down the river (in cfs)governing_location: Describes the general location of the gauge (State, USA)lastupdate: The timestamp of the most recent data received from the gauge
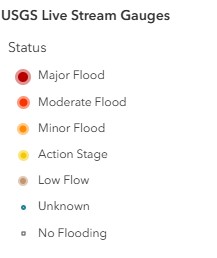
Symbology:
ESRI basic point
Icon: Geometric symbols imported from ESRI basic polygons
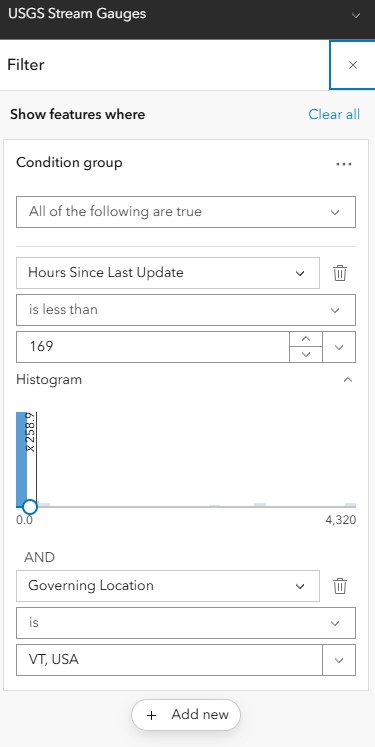
Filtered by State
USGS Stream Gauges Updates
USGS gauges typically update every 15 to 60 minutes.
USA Storm Reports (past 24 hours)
Source: NOAA
Geometry Type: Point
Coordinate System: Web Mercator (EPSG:3857)
Update Method: Updated daily by NOAA/NWS
Pop-Up Attributes:
INCIDENT_TYPE: Type of storm incident (e.g., Heavy Snow, Snow, Sleet, Hail, etc.)LOCATION: Description of locationINCIDENT_DATETIME: Timestamp for storm reportCOUNTY: County nameSTATE: State nameCOMMENTS: Relevant comments
Symbology:
Color-coded by report_type
Icon: Pre-defined symbology by NOAA
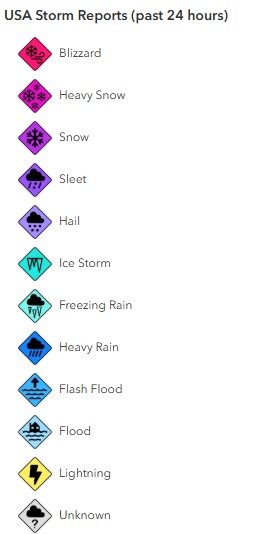
Filter:
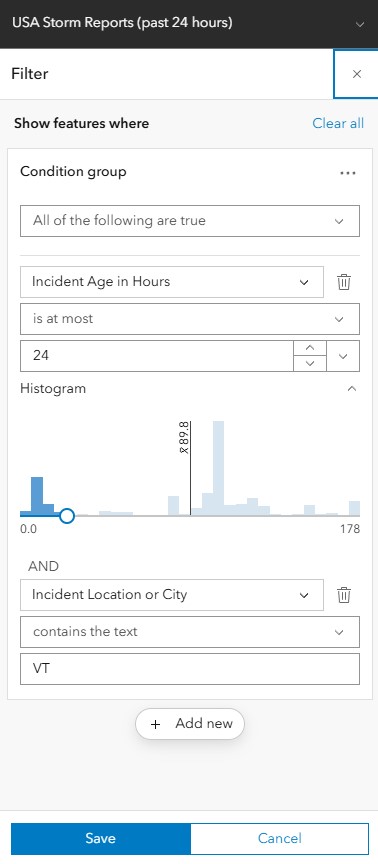
Filtered by HOURS_OLD and location
Data Limitations
Weather alert data may be delayed during severe weather events when NWS systems experience heavy load.
NOAA Hail Storm Reports (past 24 hours)
Source: NOAA
Geometry Type: Point
Coordinate System: Web Mercator (EPSG:3857)
Update Method: Updated daily by NOAA/NWS
Pop-Up Attributes:
LOCATION: Description of locationUTC_DATETIME: Timestamp for hail reportCOUNTY: County nameSTATE: State nameCOMMENTS: Relevant comments
Symbology:
ESRI basic point
Icon: Pre-defined symbology by NOAA
Filter:
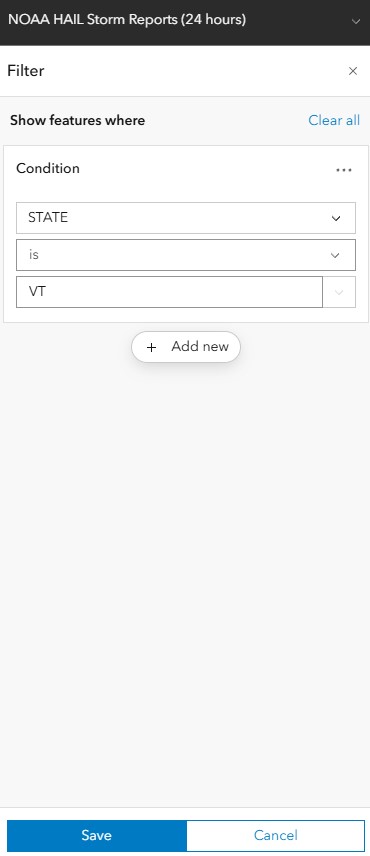
Filtered by STATE
NOAA Wind Storm Reports (past 24 hours)
Source: NOAA
Geometry Type: Point
Coordinate System: Web Mercator (EPSG:3857)
Update Method: Updated daily by NOAA/NWS
Pop-Up Attributes:
LOCATION: Description of locationUTC_DATETIME: Timestamp for hail reportCOUNTY: County nameSTATE: State nameCOMMENTS: Relevant comments
Symbology:
ESRI basic point
Icon: Pre-defined symbology by NOAA
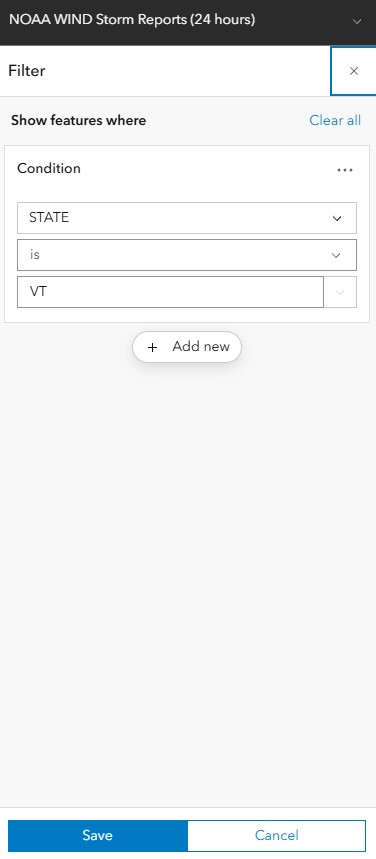
Filter:
Filtered by STATE
Current NWS Events
Source: NOAA
Geometry Type: Polygon
Coordinate System: Web Mercator (EPSG:3857)
Update Method: Updated daily by NOAA/NWS
Pop-Up Attributes:
Event: NWS event type (e.g., Flash Flood Watch, Fire Warning, Winter Weather Advisory, etc.)Affected: Geographic areas affectedSummary: Concatenated summary of event, time period of event, and issuing NWS office.Updated: Time/date last updatedStart: Start time of event noticeEnd: End time of event noticeDescription: Detailed description of the NWS eventInstruction: Authoritative instructions for how to prepare/respond to NWS event
Symbology:
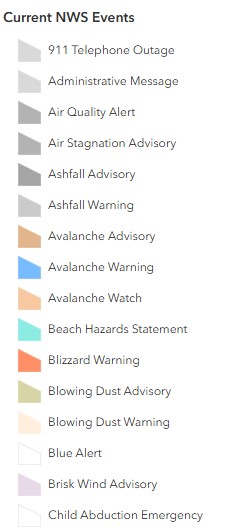
Color-coded by Subject Type
Icon: Pre-defined symbology by NOAA
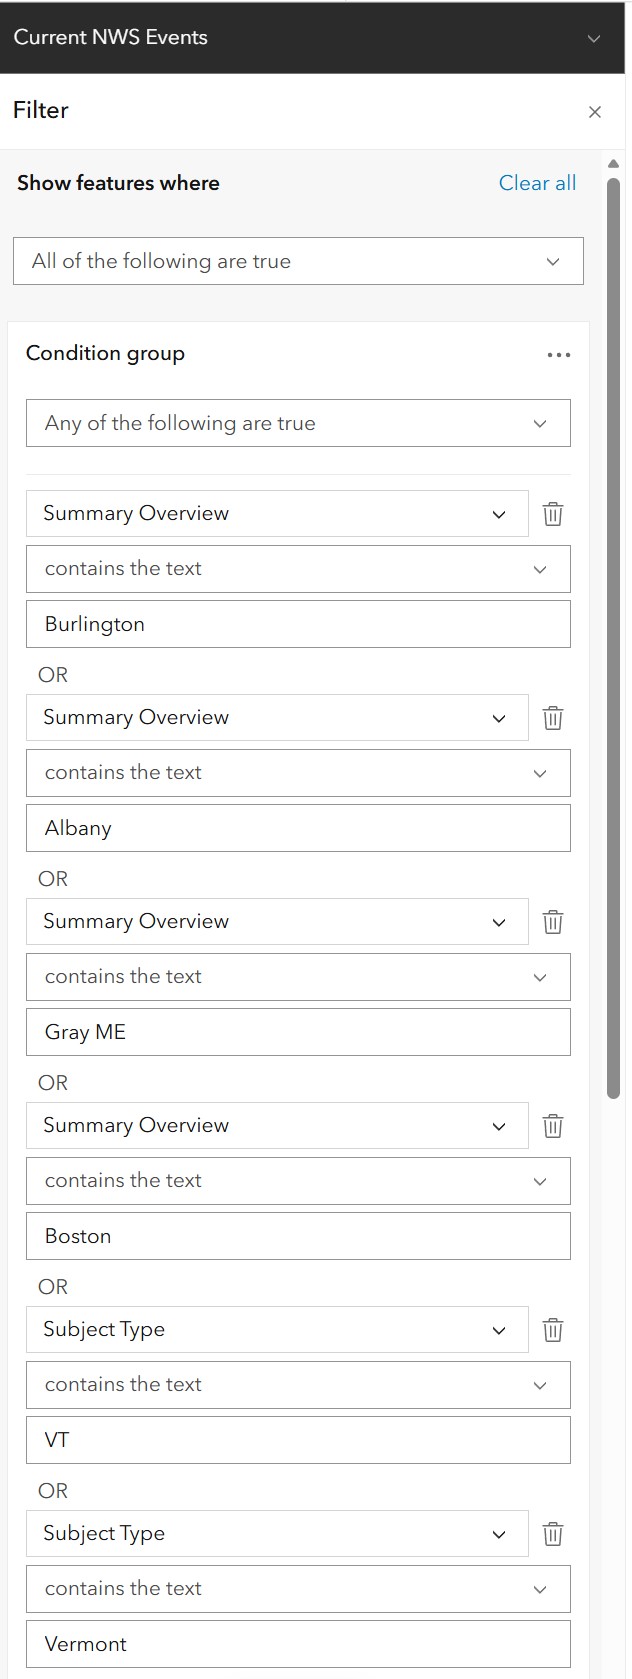
Filter:
Filtered by Summary Overview
Data Limitations
Weather alert data may be delayed during severe weather events when NWS systems experience heavy load. Polygons represent alert zones, not exact impact areas.
NOAA Severe Thunderstorm Warnings
Source: NOAA
Geometry Type: Polygon
Coordinate System: Web Mercator (EPSG:3857)
Update Method: Updated daily by NOAA/NWS
Pop-Up Attributes:
UTC_ISSUE: Date/time warning was issuedUTC_EXPIRE: Date/time warning expires
Symbology:
ESRI basic polygon
Icon: Pre-defined symbology by NOAA
Filter:
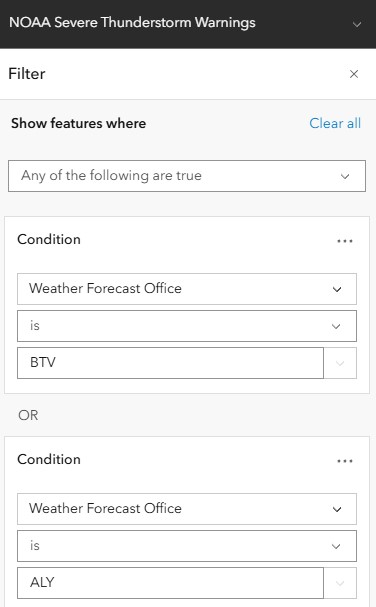
Filtered by Weather Forecast Office = BTV OR Weather Forecast Office = ALY
NOAA Tornado Warnings
Source: NOAA
Geometry Type: Polygon
Coordinate System: Web Mercator (EPSG:3857)
Update Method: Updated daily by NOAA/NWS
Pop-Up Attributes:
UTC_ISSUE: Date/time warning was issuedUTC_EXPIRE: Date/time warning expires
Symbology:
ESRI basic polygon
Icon: Pre-defined symbology by NOAA
Filter:
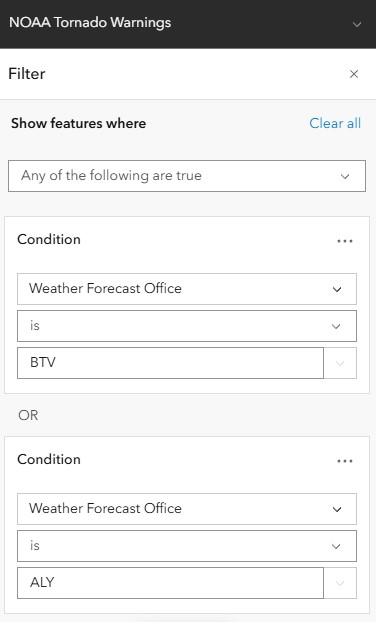
Filtered by Weather Forecast Office = BTV OR Weather Forecast Office = ALY
NOAA Flash Flood Warnings
Source: NOAA
Geometry Type: Polygon
Coordinate System: Web Mercator (EPSG:3857)
Update Method: Updated daily by NOAA/NWS
Pop-Up Attributes:
UTC_ISSUE: Date/time warning was issuedUTC_EXPIRE: Date/time warning expires
Symbology:
ESRI basic polygon
Icon: Pre-defined symbology by NOAA
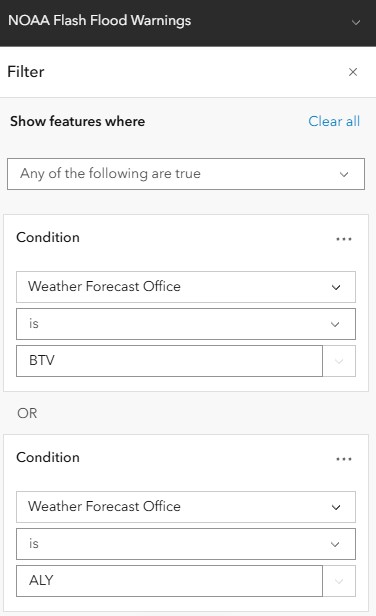
Filter:
Filtered by Weather Forecast Office = BTV OR Weather Forecast Office = ALY
NOAA Special Marine Warnings
Source: NOAA
Geometry Type: Polygon
Coordinate System: Web Mercator (EPSG:3857)
Update Method: Updated daily by NOAA/NWS
Pop-Up Attributes:
UTC_ISSUE: Date/time warning was issuedUTC_EXPIRE: Date/time warning expires
Symbology:
ESRI basic polygon
Icon: Pre-defined symbology by NOAA

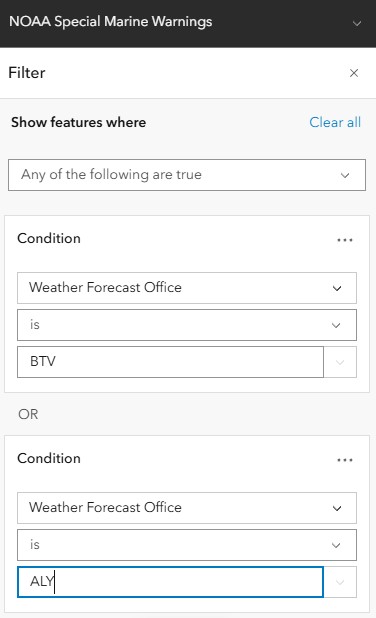
Filter:
Filtered by Weather Forecast Office = BTV OR Weather Forecast Office = ALY
Active Hurricanes, Cyclones, and Typhoons
Source: NOAA
Geometry Type: Points, Lines, Polygons
Coordinate System: Web Mercator (EPSG:3857)
Update Method: Updated daily by NOAA/NWS
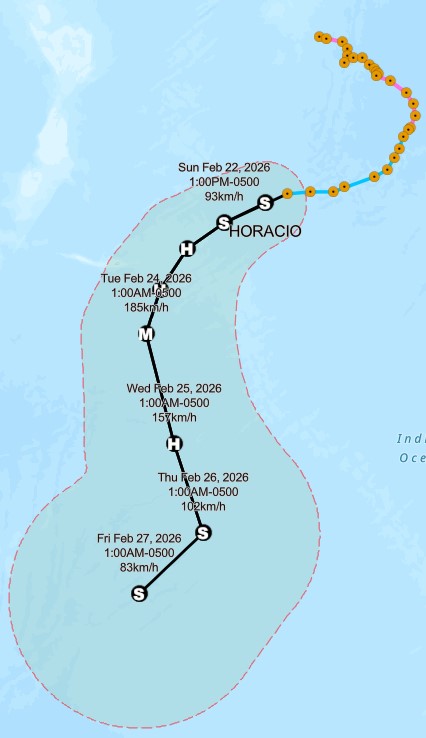
Grouped Feature Layer
This grouped service contains the following layers, which depict active hurricanes and associated storm characteristics.
- Forecast Position
- Observied Position
- Forecast Track
- Observed Track
- Forecast Error Cone and Danger Area
- Watches and Warnings
- Tropical Storm Force (34kts)
- Tropical Storm Force (50kts)
- Tropical Storm Force (64kts+)
- Raw 1 10th Degree Data (All)
- Observed Wind Swath
Symbology:
Point, Polyline, Polygon
Icon: Pre-defined symbology by NOAA
Wind Gust Projections
Source: NWS
Geometry Type: Polygon
Coordinate System: Web Mercator (EPSG:3857)
Update Method: Automatically updated by NWS
Pop-Up Attributes:
label: The forecasted gust speed Range (in mph and km/h)Speed Class (Beaufort Scale): The Beaufort wind force scale category description (e.g., Gentle Breeze, Strong Breeze, Violent Storm, etc.)Description: The Beaufort scale description combined with labelFrom Date: The beginning of the valid forecast periodTo Date: The end of the valid forecast period
Symbology:
Color-coded by Speed Class (Beaufort Scale)
Icon: Geometric symbols imported from ESRI basic polygons
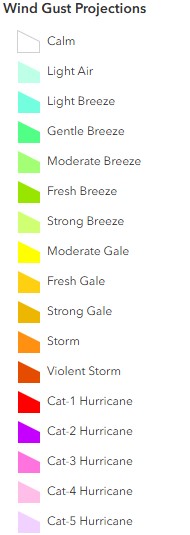
Wind Gust Projections
NWS forecasts are often broken into 1-hour, 3-hour, or 6-hour blocks. A polygon on the map represents the maximum gust expected between the From Date and To Date.
NWS River Gauges
Source: NWS Geometry Type: Point Coordinate System: NAD83(NSRS2007) (EPSG:4759) Update Method: Automatically updated by NWS
Pop-Up Attributes:
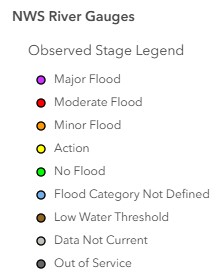
Gauge ID: A unique 5-character alphanumeric identifier assigned by the National Weather Service (e.g., BTVV1 for Burlington).Flood Hazard Value: The current water level measurement relative to the highest NWS flood category reached (Action, Minor, Moderate, or Major).Flood Status: A text description of the current severity (e.g., "No Flooding," "Minor Flooding," or "Major Flooding") based on the latest observation.Gauge Location: The descriptive name of the station, typically including the river name and the nearest town or city (e.g., "WINOOSKI RIVER AT ESSEX JUNCTION").Hydrograph: A dynamic URL that links to the official NWS hydrograph image, showing the last few days of observations and the next few days of predicted water levels.Major Flood Danger Value: The specific water level (stage) at which "Major" flooding begins; this is the threshold where extensive inundation of structures and roads is expected.Observation Time: The exact date and time (usually in UTC) when the most recent physical measurement was recorded at the gauge site.Observed: The numerical value of the most recent water level measurement (Stage in feet or Flow in cubic feet per second).Units: The unit of measurement for the Observed value, typically "ft" (feet) for stage height or "kcfs" (kilo-cubic feet per second) for discharge.Water Body: The name of the river, stream, creek, or lake where the gauge is physically located.Water Level In Need of Action: Also known as "Action Stage"; the water level where the NWS or local officials need to begin taking preparatory mitigation actions before actual flooding begins.
Symbology:
ESRI basic point
Icon: Geometric symbols imported from ESRI basic polygons
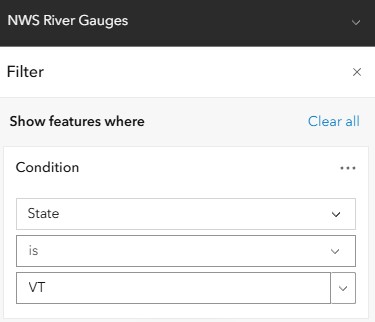
Filtered by State
NWS River Gauges Updates
NWS river gauge data typically update every 15 to 60 minutes.
NWS Radar
Source: NWS
Geometry Type: n/a (Image Service)
Coordinate System: WGS1984 (EPSG:4326)
Update Method: Automatically updated by ESRI
This image service displays the NWS CONUS_BREF_QCD radar product. CONUS = Continental United States, BREF = Base Reflectivity, which is the "raw" echo intensity from the lowest tilt of the radar (0.5°), which shows what is happening closest to the ground, and QCD = Quality Controlled Data. This means the NWS has run an algorithm to remove "non-meteorological" noise, such as ground clutter (buildings/mountains) or sun spikes, to clean up the image. Units are dBZ (Decibels of Z), which is a logarithmic scale representing the energy reflected back to the radar dish.
Symbology:
ESRI Image Service
Color Ramp: Pre-defined symbology by NWS

dBZ Range Interpretation:
This table outlines the standard relationship between radar reflectivity values (measured in dBZ) and precipitation intensity. Note that the same dBZ value indicates different conditions depending on whether the precipitation is liquid (rain) or frozen (snow/hail). While high values (>50 dBZ) typically indicate heavy rain in summer, even moderate values (30–40 dBZ) can signify dangerous whiteout conditions during winter storms.
| dBZ Range | Intensity Category | Summer Interpretation | Winter Interpretation |
|---|---|---|---|
| < 10 | Non Precipitation | Clouds, fog, smoke, or dust | Very light snow flurries or ice crystals |
| 10 - 20 | Very Light | Light mist or drizzle | Winter Light snow (trace accumulation) |
| 20 - 30 | Light | Light steady rain | Moderate snow accumulation |
| 30 - 40 | Moderate | Moderate rain | Heavy snow (whiteout conditions) |
| 40 - 50 | Heavy | Heavy rain | Extremely heavy snow or sleet mix |
| 50 - 60 | Intense | Very heavy rain / thunderstorms | Hail is likely forming |
| 60 - 70 | Extreme | Flash flood producing rain | Severe hail (golf ball+ size) |
| > 70 | Catastrophic | Extreme storm core | Giant hail (baseball+ size or debris) |
NWS Ice Accumulation Forecast
Source: NWS
Geometry Type: Points, Lines, Polygons
Coordinate System: Web Mercator (EPSG:3857)
Update Method: Updated daily by NWS
Grouped Feature Layer
This grouped service contains the following layers, which depict variations on ice accumulation forecasts from the NWS:
- Amount by Time
- Accumulation by Time
- Cumulative Total
Pop-Up Attributes:
The attributes below is the same for all three layers.
label: Summarizes forecasted accumulation range (in inches)fromdate: The beginning of the valid forecast periodtodate: The beginning of the valid forecast period
Symbology:
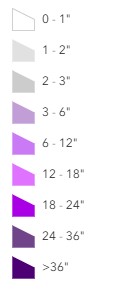
The symbology below is the same for all three layers.
ESRI basic polygon
Icon: Pre-defined symbology by NWS
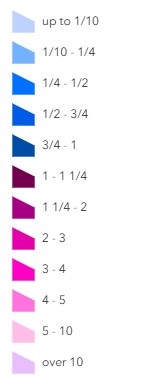
NWS Snowfall Forecast
Source: NWS)
Geometry Type: Points, Lines, Polygons
Coordinate System: Web Mercator (EPSG:3857)
Update Method: Updated daily by NWS
Grouped Feature Layer
This grouped service contains the following layers, which depict variations on snowfall forecasts from the NWS:
- Amount by Time
- Accumulation by Time
- Cumulative Total
Pop-Up Attributes:
The attributes below is the same for all three layers.
label: Summarizes forecasted accumulation range (in inches)fromdate: The beginning of the valid forecast periodtodate: The beginning of the valid forecast period
Symbology:
The symbology below is the same for all three layers.
ESRI basic polygon
Icon: Pre-defined symbology by NWS
Public Reports - CMOR
Source: CMOR
Geometry Type: Point
Coordinate System: WGS1984 (EPSG:4326)
Update Method: Automatically updated by the CMOR via public submissions
Pop-Up Attributes:
Description and/or caption information: User submitted observationsSelect a county: County of submission/observationWhat is the date?: Date of submission
Symbology:
ESRI basic point
Icon: Pre-defined symbology by CMOR
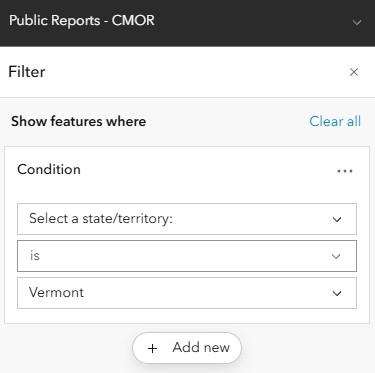
Filter:
Filtered by Select a state/territory
CMOR Updates
CMOR submissions are provided via public submission and should be verified prior to mobilizing resources.
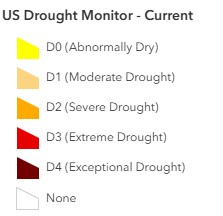
US Drought Monitor - Current
Source: USDM
Geometry Type: Polygon
Coordinate System: Web Mercator (EPSG:3857)
Update Method: Manually updated (weekly) by the National Drought Mitigation Center
Pop-Up Attributes:
DM: Drought Monitor Category (e.g., Abnormally Dry, Severe Drought, etc.)DMArea_Units: The raw area of the drought polygon in square miles (mi²)CatagoricalPerct: The percentage of the area exclusively in each specific drought categoryCumulativePerct: This is the "or worse" statistic. It represents the percentage of the area in the specific drought category plus all more severe categoriesReleaseDate: The release date of the updated feature layerValidStart: The start date of the observation weekValidEnd: The end date of the observation week
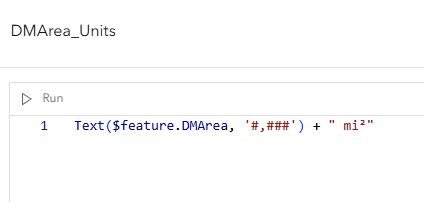
Attribute Expressions (Arcade):
The original DMArea field was rounded and units were added for easier interpretation using the DMArea_Units field.
Symbology:
ESRI basic polygon
Icon: Pre-defined symbology by USDM
Basemap
Default: Topographic for visualizing data relative to Vermont's variable topography
Performance Notes
For optimal performance with this map:
- Recommended to keep 4-5 layers active simultaneously
- Turn off reference layers when not needed
- Use time filters to limit historical data queries