Weather Page
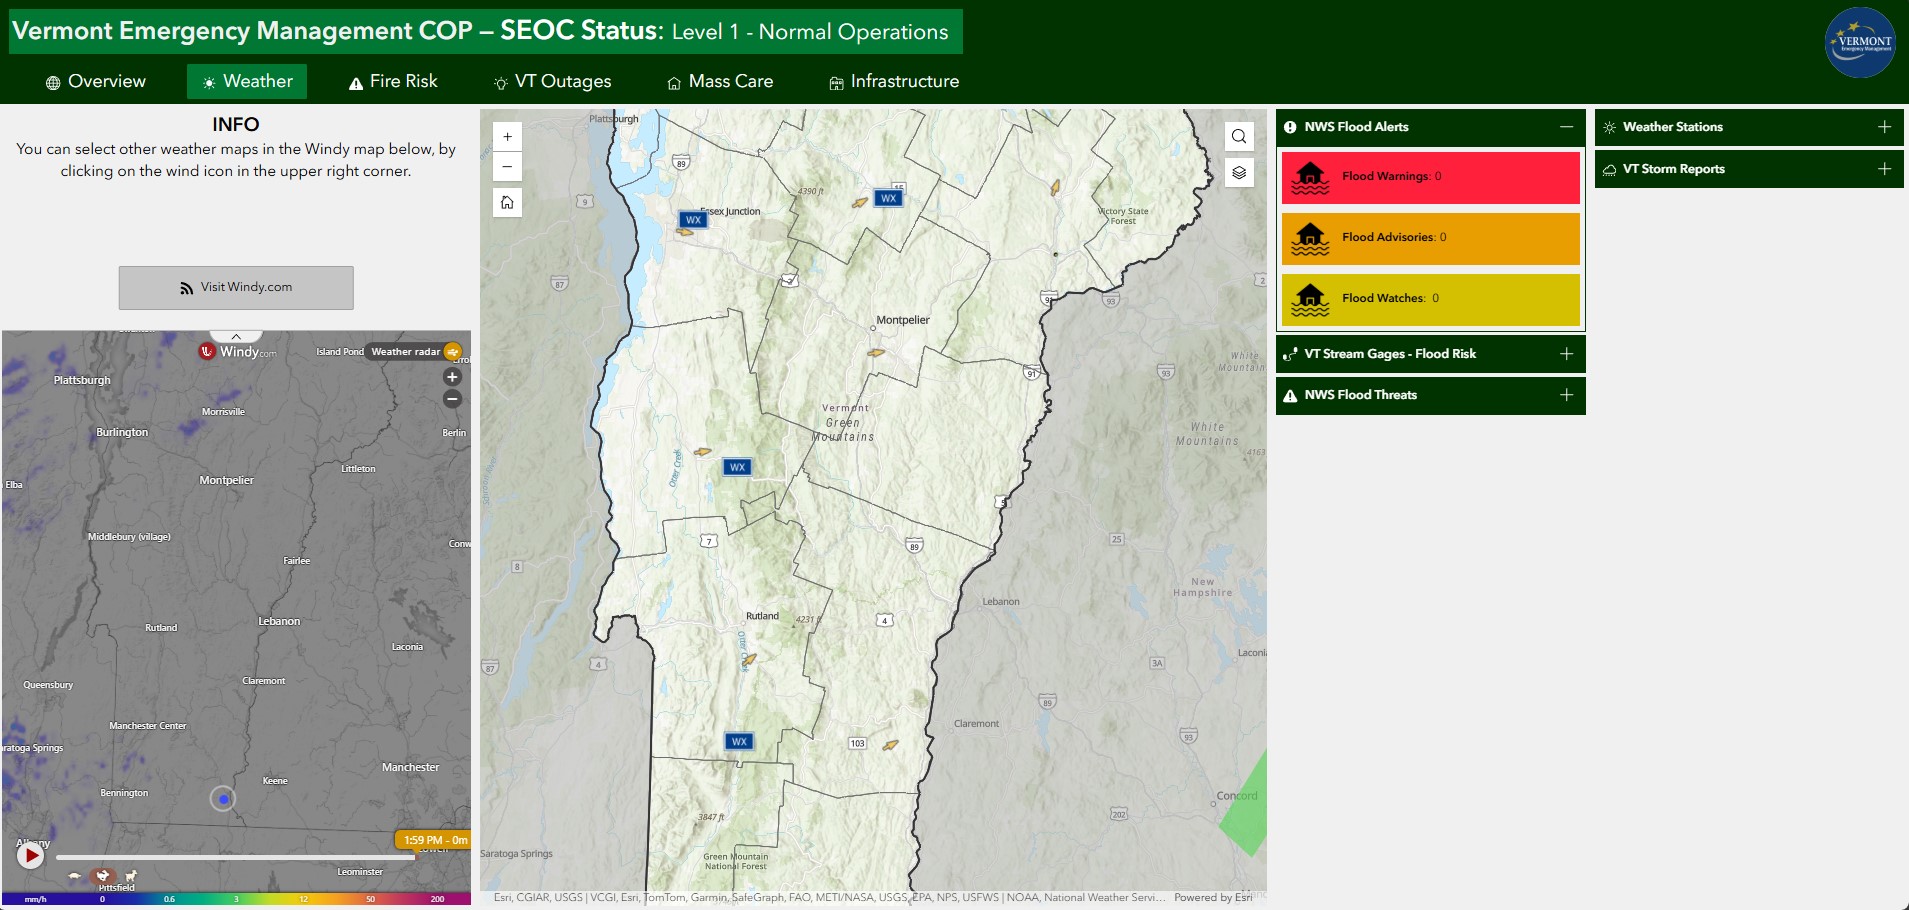
The Weather page provides a comprehensive, near real-time overview of meteorologic and hydrologic conditions in Vermont.
Purpose
This page provides:
- Quick overview of weather conditions
- Summary of weather alerts and storm reports
- Weather related radar products (e.g., wind, precipitation, etc.)
- Quick access to stream hydrologic conditions
Weather Page Layout
The page uses a fullscreen layout with the following components:
- Header: Application title, dynamic status text and color, date/time, and logo. Review the COP Overview Page for more details.
- Navigation: Tab-based navigation between different views. Review the COP Overview Page for more details.
- Map Area(s): Primary interactive map areas.
- Side Columns: Widgets for data display and interaction.
Sidecar Section
The left side of the page contains a Sidecar Widget the user can expand/contact. It contains the following elements:
Click For More Info
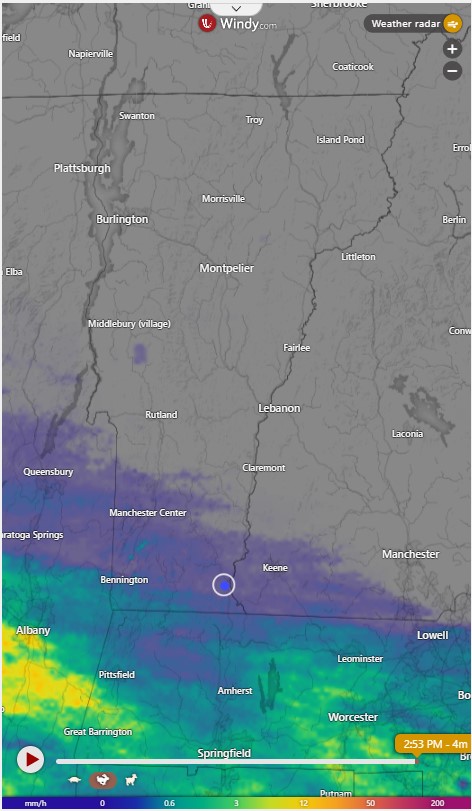
- Sidecar Widget: The upper container is expanded by default and displays help info to the user. When collapsed the user can interact with the Windy map and the embedded Weather map for comparison.
The user can also change the data product displayed in the embedded Windy map by clicking the orange wind icon (next to the Weather radar label). The Windy map has time enabled radar so the user can evaluate future conditions and can also expand the map in a new browser window if they prefer.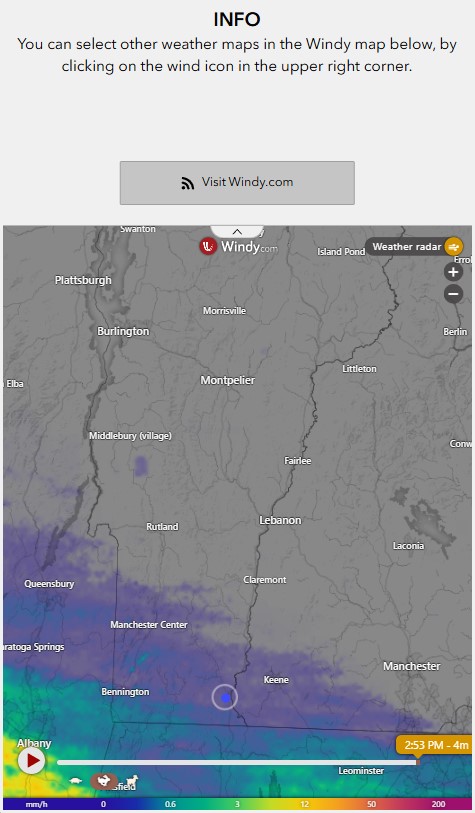
Map Section
The center visual of the page contains the weather map. For more information on the data layers displayed in the map, visit the Weather Map page. The map widget contains the same Zoom Controls, Home Button, Search, and Layers Toggle tools as the Overview Map. Please review those tool features here.
Accordion Sections
The right side of the page displays two columns containing accordion widgets, which allow users to expand/contract content linked to data layers in the map.
Click For More Info
-
VT Flood Alerts Accordion Widget: The primary accordion widget contains a Row Widget, which contains an Image Widget and Text Widget. Each text widget is linked to the Current NWS Events layer. The
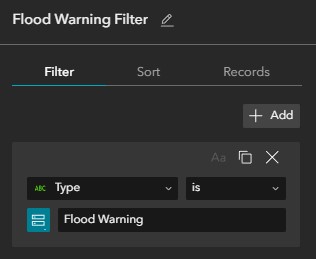
Current NWS Eventslayer was filtered for each of the three text widgets (e.g., the Flood Warning text widget was filtered as shown below).
The background colors in the text boxes are static not dynamic: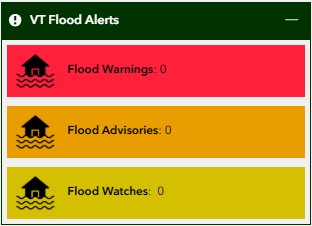
- Flood Warnings = (#ff203c).
- Flood Advisories = (#e89d00).
- Flood Watches = (#d4c000).
-
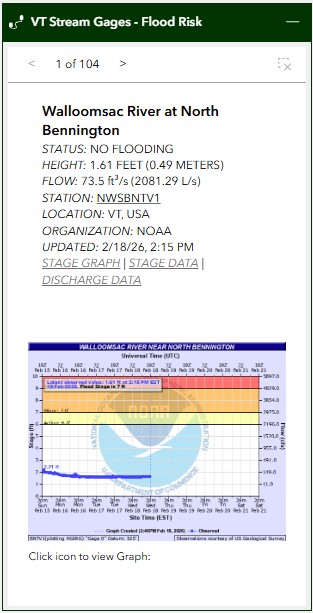
VT Stream Gauges - Flood Risk Accordion Widget: The primary accordion widget contains a Feature Info Widget linked to the USGS Live Stream Gauges layer. The user can navigate between each feature summary using the navigation arrows. When the user navigates through each entry, the map zooms to the selected stream gauge on the map. The user can clear the selected stream gauge and reset the map view by clicking on the clear selection button (x inside dashed square). If the user clicks on the USGS hydrograph snapshot, a larger version will open in a new browser window.
-
NWS Flood Threats Accordion Widget: The primary accordion widget contains a List Widget linked to the NWS River Gauges layer. The user can select each flood threat entry. When the user clicks on each entry, the map zooms to the selected gauge station.
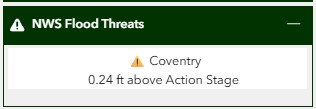
Arcade Expressions Used in the NWS Flood Threats Accordion Widget:
The following expression was used to visualize the potential Flood Risk Severity:
Flood Severity Calculation// Force Field to a Number and Default to 0 if null var obs = Number(DefaultValue($feature.Observed, 0)); var action = Number(DefaultValue($feature.action, 0)); var major = Number(DefaultValue($feature.major, 0)); var loc = $feature.location; // Only proceed if there is actual water AND an actual action level if (obs == 0 || action == 0) { return ""; } // Only show if the river is TRULY above action stage if (obs > action) { // Check for Major Flood if (major > 0 && obs >= major) { return "🚨 " + loc + "\nCRITICAL: " + Round(obs - major, 2) + " " + $feature.units + " above Major"; } // Standard Action Stage return "⚠️ " + loc + "\n" + Round(obs - action, 2) + " " + $feature.units + " above Action Stage"; } // 3. If below the threshold, return nothing return "";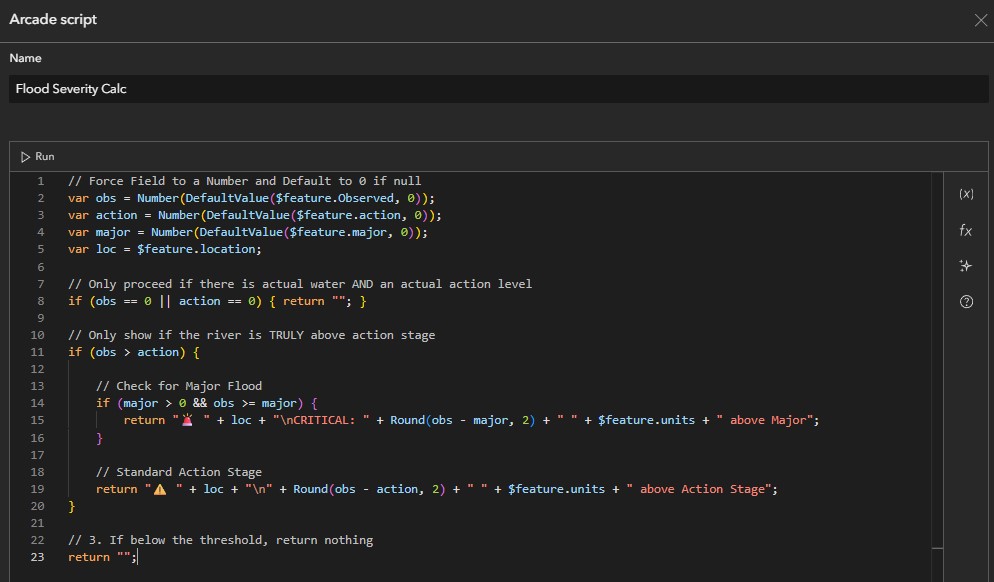
-
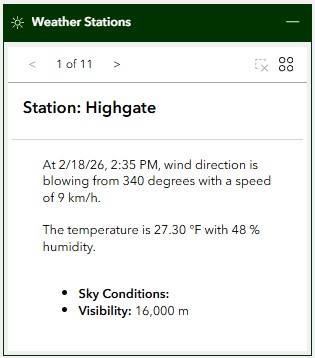
Weather Stations Accordion Widget: The primary accordion widget contains a Feature Info Widget linked to the NWS Weather Stations layer. The user can navigate between each feature summary using the navigation arrows. When the user navigates through each entry, the weather station is highlighted on the map. The user can clear the highlighting by clicking on the clear selection button (x inside dashed square).
-
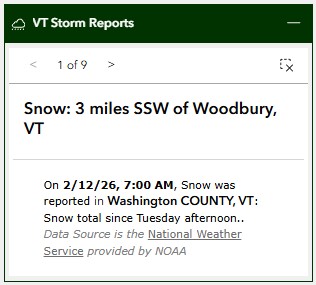
VT Storm Reports Accordion Widget: The primary accordion widget contains a Feature Info Widget linked to the NWS USA Storm Reports layer. The user can navigate between each feature summary using the navigation arrows. When the user navigates through each entry, the storm report is highlighted on the map. The user can clear the highlighting by clicking on the clear selection button (x inside dashed square).
Best Practices
Performance Optimization
- Keep 4-5 layers active for best performance
- Use appropriate zoom levels for data visibility
- Clear old incidents and events periodically
- Close unused widgets when not needed
Data Interpretation
- Check timestamps on data feeds
- Verify alert severity levels
- Cross-reference multiple data sources
- Consider data aggregation levels
Related Pages
- Fire Risk Page - Detailed fire danger and current wildfire status
- VT Outages Page - Power outage tracking
- Infrastructure Page - Transportation status
Feedback
If you have suggestions for improving this page or need additional functionality, contact John Van Hoesen.